The chicken or the egg
The relationship between the number of chargers and the number of electric vehicles is a classic chicken and egg problem. In countries where EV sales are still lagging, like Australia, New Zealand and the US, charge point operators (CPOs) may be inclined to wait for the sales to pick up before heavily investing in rolling out their charging networks. At the same time, a limited availability of public charging infrastructure and the resulting range anxiety are some of the main reasons people will wait to trade in their conventional vehicle for an EV.

Sandra Bronsvoort, Subject Matter Expert eMobility
"Coverage, waiting times, and profitability: finding the sweet spot is a complex puzzle."
Charging networks are developing at different speeds, in different ways
The metric that describes this relationship is the EV-to-charger ratio. It’s one of the key indicators to assess the suitability of a charging network. Globally, we see charging networks developing at different speeds, and in different ways. However, a commonly observed trend is that EV-to-charger ratios are initially low (relatively many chargers for every EV), as initial infrastructure deployment often precedes EV sales. As the share of EVs as part of the total vehicle stock grows, this number tends to drop.
For Europe, a ratio of 10 EVs per public charger is recommended as the minimum public charger coverage on highways. Norway however – the country that is absolutely leading the EV adoption with over three-quarters of new cars sold being battery electric vehicles – only has one charger per 34 EVs. But with a relatively high share of free-standing residential houses (with garages), most charging takes places at home.
With 5 EVs per charger, The Netherlands is doing well compared to the EU standard. However, fast chargers only make up 3% of the country’s total, compared to nearly 35% in Norway. As fast chargers can serve more EVs over the same time frame than slower chargers, kilowatts-per-EV or charger power is another key metric to consider when designing efficient charging networks.
Maximizing charge point profitability and minimizing wait times: a complex puzzle
Both the EV-to-charger ratio and the kilowatts-per-EV directly influence the expected queue lengths and wait times at charging stations. Charging an electric vehicle is quite different from refueling a fossil fuel car. Where the average fill-up might only take two minutes for conventional vehicles, charging an EV will take at least 20 minutes depending on the battery and charger speed. As a direct result, drivers arriving at a charger that is currently in-use are more inclined to drive to the next charge point instead of queuing up. Companies developing these stations need to make sure charge points have sufficient availability and wait times are minimal.
Yet, resources are limited. CPOs are aiming for short payback periods and a high return on investment. They want to make sure the network density is suitable for the number of EVs in the area and that chargers have a high utilization. It’s therefore important to find the sweet spot to maximize charge point profitability. This proves to be a complex puzzle.
"CPOs want to make sure the network density is suitable for the number of EVs in the area and that chargers have a high utilization"
EV charging demand forecasting: nowhere near easy
It starts with accurately forecasting the demand for EV charging, and especially for private transport this is nowhere near easy. It is the result of a complex interplay between travel patterns, demographic factors, car ownership trends, government policies and technological developments, and there’s limited historical data available. It gets even more difficult when considering that demand in a certain area will depend on the proximity of other charging points and might be impacted by the competition’s strategy.
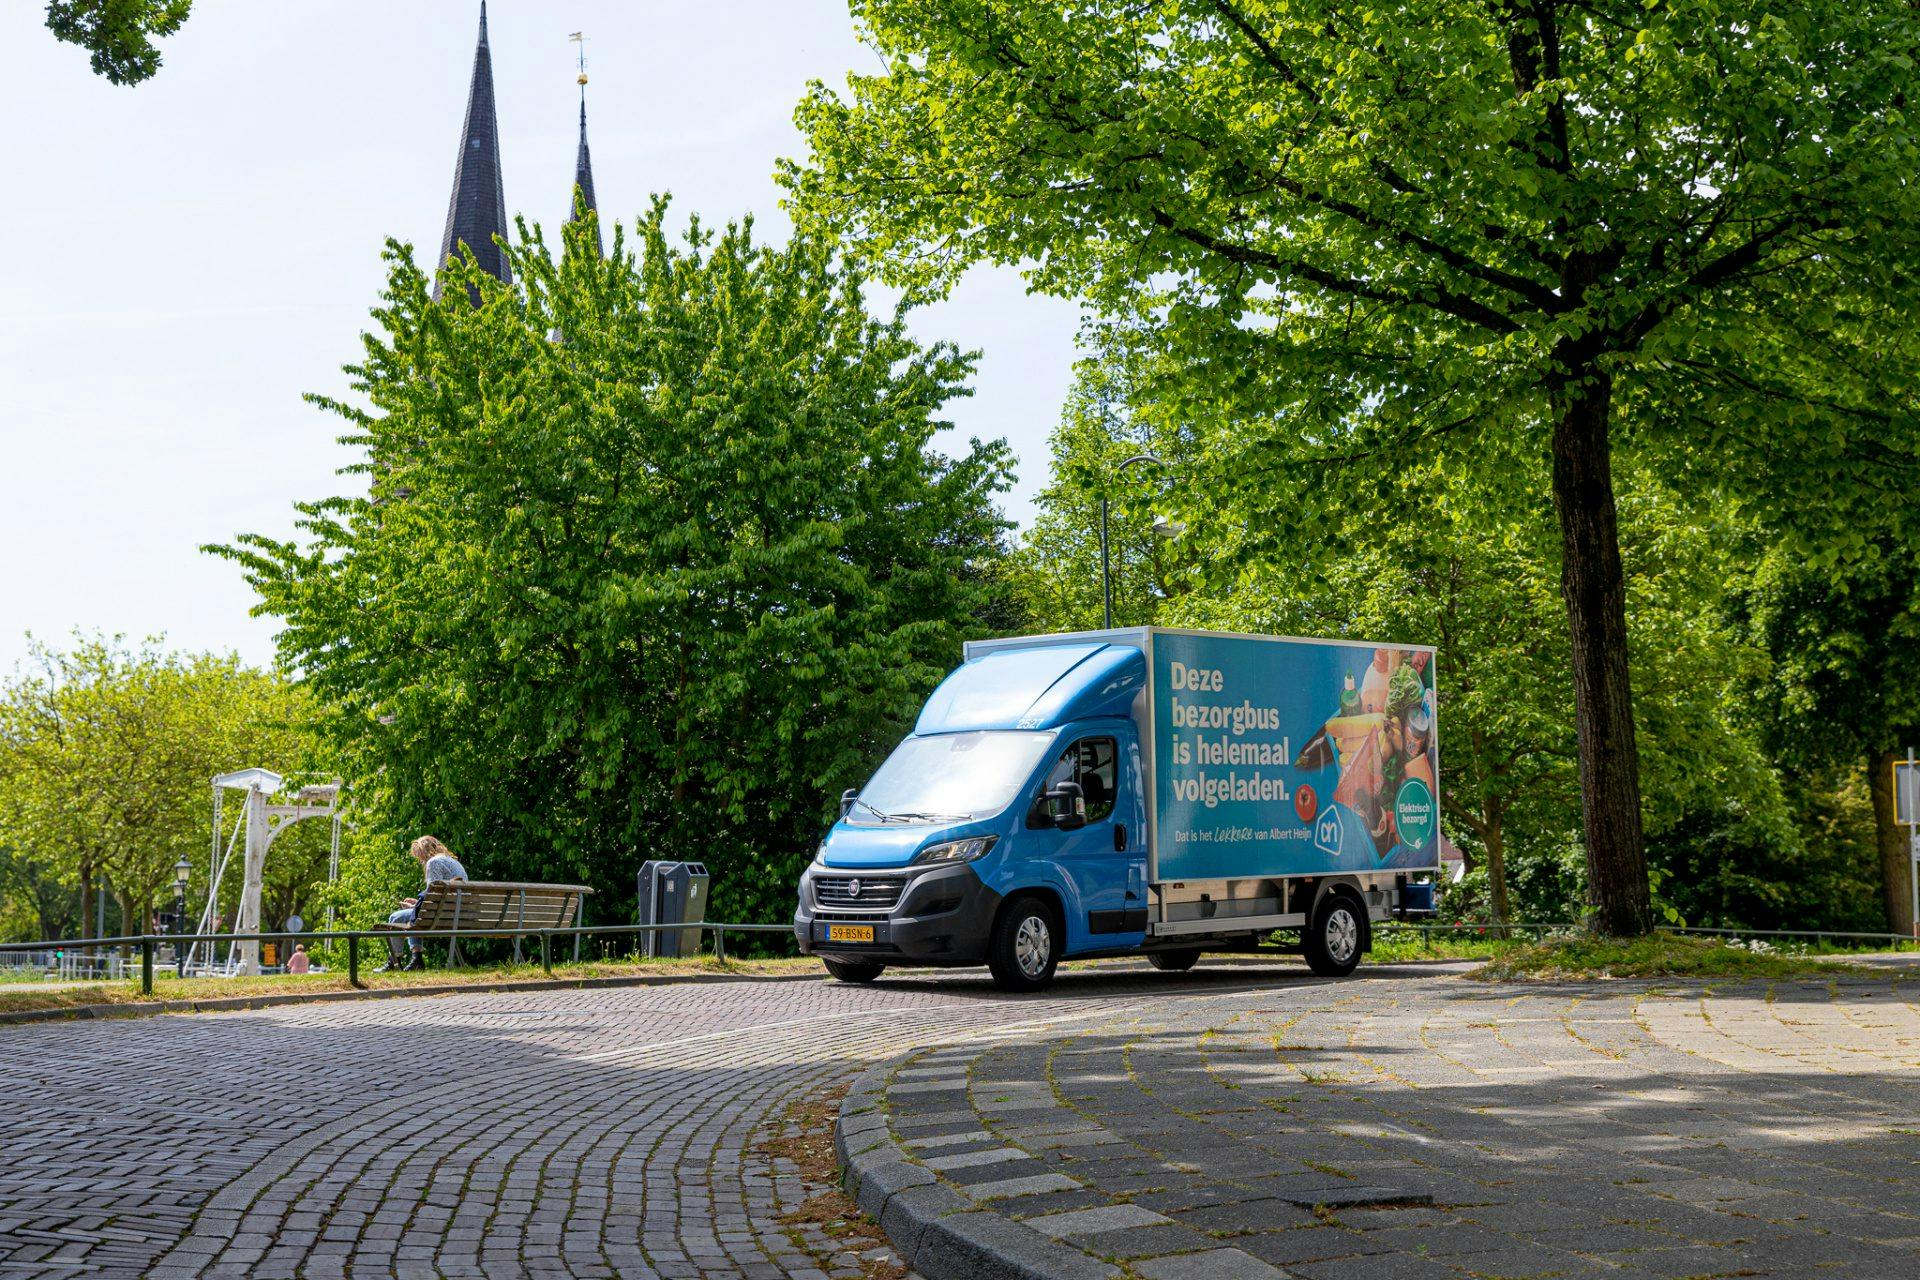
The charging behavior of commercial vehicles is often easier to predict and orchestrate. Trucks, delivery vans and heavy-duty vehicles are expected to mainly charge overnight. In addition, driving shifts and breaks for these types of vehicles are dictated by regulation in most countries. This makes it easier to forecast driving patterns and therefore, charging times.
As demand is one of the main drivers in decision making around charging infrastructure investments, it is wise to test and evaluate different forecasting methods and further improve accuracy using modern machine learning techniques. In addition, we recommend analyzing different scenarios rather than focusing on a single demand figure, to increase the resilience of your future network even further.
Designing the charging networks of the future
Once you understand what future demand will look like, you can use this as input for network modelling to identify the best locations for your charge points. It is well known that EV charging can add significant pressure on the power grid, depending on the peak demand, the type of chargers built and the number of connections. Grid capacity is constrained, and expensive grid upgrades may be necessary for certain locations. The good news is that this additional stress on the grid can often be limited by equipping charging stations with solar panels or wind turbines, combined with battery storage. This will not only bring down capital investment costs, but operating costs as well, as it will enable you to make the most use of renewable energy and take electricity off the grid when prices are low. We therefore recommend incorporating the charging station configuration early in the planning processes, ideally when selecting new station locations.
“Choosing the right configuration of solar, wind and battery capacity allows you to maximize the profitability of your charge points”
Accelerate the transition towards zero-emission mobility
As we explain above, the definition of a healthy charging landscape is not trivial. It may differ per country, or even area, and depend on many factors such as demographics and the average distance travelled, as well as the company’s mission and strategy. Despite the significant levels of uncertainty the EV sector is still facing, the outlook for the market is strong and with the right tools and knowledge, CPOs can counter that uncertainty.
Choosing the right configuration of solar, wind and battery capacity allows you to maximize the profitability of your charge points, make your offering even greener and accelerate the transition towards zero-emission mobility.
Source: https://www.iea.org/reports/global-ev-outlook-2022/trends-in-charging-infrastructure


